


")


This is post 4 on Game Theory examples and their application to innovation and management…enjoy! To access the other posts on game theory, click the links below:
To view my other posts on game theory, see the list below:
Game Theory Post 1: Game Theory Basics – Nash Equilibrium

FREE VIDEO TRAINING FOR INNOVATORS
Over 100 Slides Free and Downloadable as a PDF
Game Theory Post 2: Location Theory – Hotelling’s Game
Game Theory Post 3: Price Matching (Bertrand Competition)
Game Theory Post 5: Mixed Strategies
To follow along in Excel, download the free Game Theory Demand and Price Discrimination Template here.
In 2011, activist JC Penney investor Bill Ackman pressured the struggling retailer to transform itself into a consistently top-performing department store. Throughout the Great Recession, JC Penney had failed to maintain performance and it’s stock price suffered. Ackman pushed the JCP board into hiring a retail legend to lead the turnaround – Ron Johnson from Apple. Apple’s retail stores were a booming success for the tech giant, an effort led by Johnson. Smitten by Johnson’s success at Apple, Ackman felt confident that if anyone could turn around JCP, it was Ron Johnson.
When Ron Johnson came along in the summer of 2011, he started to work on a plan that would lay the foundation for the future of JC Penney. After roughly 6 months, he came up with a plan comprised of two major ideas:
- “Fair and Square” pricing
- “Town Square” store layout
The response to this plan was tepid but optimistic. One of the reasons Johnson took aim at JCP pricing was he felt that JCP shoppers didn’t want to deal with a never ending tangle of discounts and coupons that the retailer made them jump through to get a good price on clothes. Therefore, prior to changing the store layout, Johnson’s first order of business as CEO was a complete overhaul of JCP’s pricing and branding strategy by introducing “Fair and Square” pricing.
Below is an ad touting the new policy:
This move meant the death of complicated discounts and coupons in favor of everyday flat and honest prices. Such as the ad below illustrates:
 To sell the idea to Wall Street and the JC Penney board, Johnson arranged an extravagant event where he unveiled his multi-year turnaround plan for JCP. At the event, Johnson showed several graphics that were extremely interesting – especially from an economics/game theory perspective. For example, below is a graph Johnson referred to show the percentage of sales done at a deep discount off the retail price. Johnson’s point in showing this graph was that this trend erodes the JC Penney brand credibility in the mind of consumers because eventually they’ll realize the listed retail prices were bogus.
  The real value in this graph, however, is not in the idea that >72% of JC Penney’s sales were at 50% or more discount but rather the illustration of a nearly perfect demand curve for JC Penney products. Another graph that Johnson showed in his presentation was the following:
  Johnson showed this graph to make essentially the same point – JC Penney’s pricing strategy was eroding consumer trust in the brand all with no significant difference in profitability. Though Johnson’s message may have some credibility from a pure messaging stand point, his thesis that reducing the number and frequency of discounts would drive sales volume and profitability was fundamentally flawed. Additionally, his strategy of flat pricing ignored three pillars of basic economic theory:
- Price Discrimination
- Percieved Value
- Competitive Reaction Functions
To dissect what really went wrong with Johnson’s plan, I’ll briefly go through each of these concepts with respect to JC Penney.
Price Discrimination
According to Wikipedia, the principle of Price discrimination is described as “a pricing strategy where identical or largely similar goods or services are transacted at different prices by the same provider…Price differentiation essentially relies on the variation in the customers’ willingness to pay.” Coupons are a perfect example of retailers achieving price discrimination. Some people, usually affluent or people in a hurry, don’t mind paying full retail price for products. Others, however, are willing to take the time to research coupons and deals and take those into a retailer to get a better price than the price listed. In JCP’s case, the graph’s above illustrated that JC Penney was doing fairly well at price discrimination in 2011. To illustrate this further, I’ll use the data above to draw a general demand curve for JCP.
To do this, I’ll need to do a few calculations to translate the percentage of consumers buying at certain discounts into quantity of products purchased at certain prices. Below I take the discount rates and the percent of revenue at those discounts and use the price of $30 because using $30 as the full retail price gives an overall weighted average price of $14.4 per item. With this price distribution, all I need to do now is figure out the quantity of products sold at each of those prices.
 Given that I know the average price was $14.4, all I need to do is find out JCP’s total revenue for the year and with a little algebra I can solve for the total quantity of items sold.
Total Revenue = Price x Quantity
According to Google Finance (JCP), JC Penney’s revenue in 2011 (period ending 1/28/2012) was $17,260,000,000. This means our equation is as follows:
$17,260,000,000 = $14.4 x Qd
If I assume that quantity sold is equal to quantity demanded (or Qd) then I find that JCP sold 1,230,769,231 items in 2011. By combining this data with the table from above, we get a quantity demanded at each price shown:

Note that the fourth line down titled “Quantity Demanded” shows the quantity of products demanded at that particular price. This is very helpful in order to make sales and profitability projections which I’ll do in a moment. But to create a true demand curve, we need a cumulative number.
To explain, the cumulative number simply assumes that those people who demanded the product at a higher price, will also demand it at a lower price. Though there are some pitfalls to this assumption – such as issues around percieved value – it’s still a pretty safe assumption given the purpose of constructing a general demand curve.
Now all I need to do is graph the “Retail Price” by “Cumulative Qd” and we get the following demand curve:

With this demand curve, we can start to estimate revenues JCP would get by implementing various pricing policies. For example, the above demand curve essentially represents demand for JCP products in general – without making changes to pricing policies.
First let’s illustrate the revenues JCP enjoyed in the pre-Johnson era. For this example, I chose the year ending January 29, 2011. From a demand perspective, revenues were as follows:

This curve shows a reasonable level of price discrimination and the revenues associated with the old pricing policy. Note that the modeled demand is about $100M below the actual demand. This difference is likely due to rounding and the possibility that JCP earned revenue from non-retail items such as the sale of assets or other investments in 2011.
Now let’s use this model to examine what we would expect to happen if JCP implemented Ron Johnson’s “fair and square” pricing policy. If we assume the ad for the $25 sweater above is representative, then it looks like he chose to eliminate coupons, set prices at what was previously the 50% discount price, and allow for two types of sales prices that were only available at certain times – month-long savings and 2 Friday’s every month for the best price. Though month-long savings happened every month, they were different products each time. I’ve assumed that each product JCP sold would get on the “month long savings” discount for one month out of the year. Also, with regards to the first and third Friday discounts, in the demand curve below I’ve assumed that only those products that would not sell at the higher price would be on sale on those dates. Essentially meaning that those days are the “clearance” sales. With these assumptions, let’s explore what this means from a revenue perspective:

As you can see, this model suggests that simply by changing prices to the new “fair and square” policy, JCP can expect to earn roughly $11.3B in total revenue – a loss of $6.3B! The actual revenue losses were not quite that high (roughly $4.4B) when Johnson was fired but if they had continued with the pricing policy, it’s quite possible the losses would have continued until reaching a steady state at somewhere near the predicted $11.3B above.
The fascinating part of this analysis is that we created this prediction based solely off the data provided in Ron Johnson’s January 2012 presentation – before the new policy was implemented.
Let’s now examine this from a different perspective – perceived value.
Perceived Value
The previous pricing policy of markdowns had one other distinct advantage over the “fair and square” policy – anchoring. An anchor is a cognitive bias that can dramatically impact our estimation of things. For example, what if I asked you “What is the population of Venezuela?” versus asking “Is the population of Venezuela greater or fewer than 65 Million?” (this example is borrowed from a great blog post on anchoring at youarenotsosmart.com). With the first question, you will have to make a random guess – say 10 Million. In the other question, you now have a starting point to work from and will adjust your answer based on that starting point. You might think 65 Million sounds like a lot for the small South American country but it must not be too far off, so you guess something around 40 Million.
See the difference?
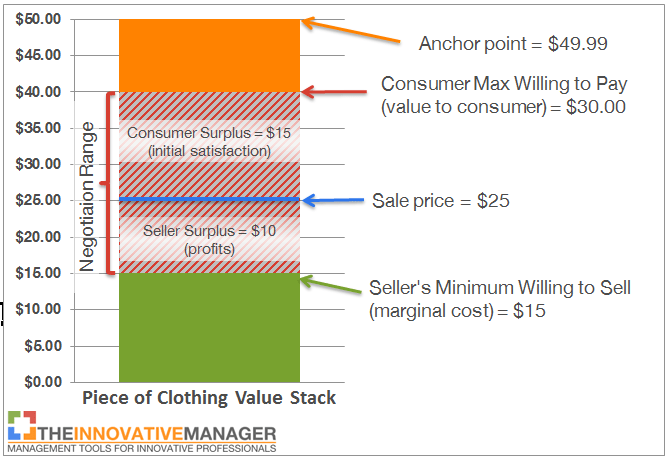
With JC Penney, every customer who walks into the store is asking themselves a similar question – “how much is this item worth to me?” Everyone wants to get a great deal but in order to know what a great deal is, you have to have an estimate its value. Under the old pricing strategy, using the sweater in the ad as an example, customers are conditioned to think that the sweater is worth $49.99 because that’s the starting point to the price. Then once the discounts are factored in, the customer perceives that the value of the sale to them is $25 ($49.99-$24.99 = $24.98). In economic terms, this represents the consumer surplus.
For example, let’s assume that with an anchor point of $49.99, a customer will perceive the value of the sweater to them as $40. If the sale price is $25 then the customer will buy it and feel satisfied that they got a good deal – $15 less than they would have paid otherwise.
The graphic below illustrates this:
Now consider what it could be like without an anchor point (i.e. the “Fair and Square” pricing policy):

With no anchor point the consumer has to guess what the value is above the listed price. For items with strong brand names, such as Apple, this is not a problem because the brand itself communicates superior value. In JC Penney’s case most of the brands they sell are somewhere in between premium and budget – or mid-tier – making value estimates for consumers much more difficult. In the graphic above, because the consumer estimated the total value of the item at somewhere around $35, if the customer decides to purchase the item they would only be getting it for $5 less than their maximum willingness to pay.
That’s the power of anchoring on perceived value.
But you can’t over do it. Using too high of anchor points can be risky because the higher you go, the higher you risk losing credibility which will do more harm than good. This is the major point Ron Johnson made in his presentation. However, if you look at the two points of comparison he used from his slide, they showed that from 2002 to 2011, 9 years, the retail price changed from $27.04 to $36 – a $9 increase. Sounds like a lot until you calculate that over that same period of time inflation grew 25% (see the inflation calculator here) making the $27.04 number equivalent to $33.81 in 2011. That’s now a difference of only $2.19 in the retail price – or anchor point. I doubt JC Penney had lost much credibility with that small difference.
Now let’s use game theory to explore how this strategy might play out from a competitive standpoint.
Competitive Reaction Functions
To apply game theory, let’s suppose you are the CEO of Macy’s and you just heard about this new “Fair and Square” pricing policy with flat prices and pre-determined sales days. Knowing that most of your stores are usually just a few mall corridors away from JC Penney, what would you do?
In thinking back to the Best Buy versus Amazon post, we discussed the idea of Bertrand competition (or best price competition). If your competitor just announced that they will freeze prices at certain points, what are your options? There are two main options in this case:
- Keep your pricing strategy of using coupons and sales
- Copy their “Fair and Square” pricing strategy
With Bertrand competition, the following would occur:

Notice the reaction functions for each company. With “Fair and Square” pricing, JC Penney’s will essentially ignore their competition’s prices. Macy’s on the other hand, assuming Bertrand competition, is to beat JC Penney’s price by $1. This scenario gives Macy’s the upper hand.
Let’s now analyze the scenarios and payoffs of the two options for each retailer. In the scenarios matrix, I assumed two buyers located in a mall who are deciding between buying a shirt at JC Penney’s or Macy’s.

Note that the numbers in the scenario matrix represent revenues (sale price x quantity) and not profits. To determine economic payoffs, we need to calculate profits by subtracting marginal cost from each revenue number.
Below are the associated profits or payoffs under each scenario:

Note that this situation is very similar to the classic game of “Prisoner’s Dilemma.” In a prisoner’s dilemma game, the participants would be better off colluding but since the incentive to defect from the collusion is so high, they both end up defecting and earning lower payoffs.
In this example, if it were legal to collude on prices, JC Penney and Macy’s would likely do so because, while heavy competition using coupons earns them both a payoff of $6, if they colluded on “Fair and Square” prices they would both earn $16. However, if JC Penney decides to go with “Fair and Square” pricing while Macy’s sticks with coupons – essentially what happened under Ron Johnson – then Macy’s will win the sale and JC Penney will often lose.
Moral of the pricing story – competitors like Macy’s loved JC Penney’s “Fair and Square” pricing policy!
Conclusion
It’s unfortunate that Ron Johnson’s vision failed. His idea was much more than price changes. He had an innovative vision for fundamentally changing the way department stores operate and if he had not made the big pricing blunder, JC Penney stores could have totally reinvented the department store.
To view more, see the links below:
Fast Company – RON JOHNSON’S 5 KEY MISTAKES AT JC PENNEY, IN HIS OWN WORDS
Business Insider – Ron Johnson Reveals How He’s Going To Make JC Penney Look More Like Apple
12 Steps to Creating A New Innovation From Scratch - FREE Video Training
Over 100 Slides Free and Downloadable As A PDF


Good article, but I think you might have failed to fully appreciate the ‘other-side’ of the argument of simplicity and perceived fairness.
Following your argument, variable pricing is optimal and fixed pricing is not. However, if you take variable pricing (different prices for different customers) to it’s extreme, then all transactions should be done through on-the-spot bargaining. If variable pricing is optimal, then bargaining is the optimal pricing strategy. This is how all transactions used to be done, so why don’t stores still do that today? Simplicity and perception of fairness (the fear of being ‘ripped off’).
1.) Bargaining complicates the process and is an added expense in terms of effort required. People don’t want to have to negotiate for every little thing.
2.) Customers are not purely rational. When they find out they paid more for an item then someone else, they become upset and may avoid doing business with that company again.
Stores found a compromise between fixed and variable pricing with coupons and sales where price is ‘balanced’ by some form of inconvenience (time waiting for a sale, and/or hassle of dealing with coupons), but simplicity and fairness are still important and need to be balanced against profit optimizing strategies that could alienate customers. My 2 cents anyways.
Great point K. Taken to its extreme variable pricing would incur greater costs than the benefits would offset. My main point was that Ron Johnson took out too much price discrimination which led to large groups of customers getting frustrated and substantial loss of revenue for JC Penny.